


A real estate market analysis is a structured review of a local property market. It studies prices, supply, demand, and neighborhood conditions to show what a property is worth and where the market is heading. Buyers use it to avoid overpaying. Sellers use it to set a listing price that attracts offers. Investors use it to decide whether an area deserves their money.
This guide explains what a real estate market analysis includes. It also covers how the analysis differs from a comparative market analysis and how to run one yourself.
What a real estate market analysis measures
Think of a market analysis as a health check for a property market. Instead of guessing, you look at evidence and draw a conclusion.
Every analysis tries to answer three questions. What is this property worth right now? What condition is the local market in? Where are prices and demand likely to go next?
The answers come from recent sales, current listings, local economic data, and the physical details of the property itself. Different people weight these inputs differently. An investor cares about rent and job growth. A homeowner cares about what the house next door sold for.
Real estate market analysis vs. comparative market analysis
People often use the two terms as if they mean the same thing. They overlap, but they are not identical.
A comparative market analysis, or CMA, is narrow. It compares one property with similar homes nearby to estimate a price. Real estate agents usually produce it for free when you list or buy.
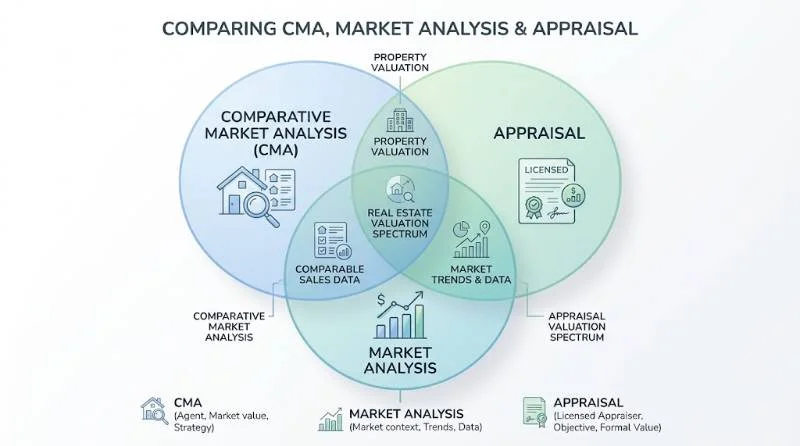
A full real estate market analysis is wider. It includes a CMA but also studies the whole market: inventory levels, price trends, employment, population growth, and future development. Investors lean on this wider view because they are buying income and growth, not just a house.
A third document is often confused with both. An appraisal is a formal valuation by a licensed appraiser. Lenders require it, and it follows strict standards that a CMA does not. A market analysis can guide your pricing, but it cannot replace an appraisal in a mortgage deal.
Why a real estate market analysis matters
1: For home buyers
A good analysis shows whether an asking price is fair. It gives you evidence for a lower offer when a home is overpriced. It also warns you when a neighborhood is cooling before you commit to a 30-year loan.
2: For home sellers
Price a home too high and it sits, collecting stale days on the market. Price it too low and you leave money behind. An analysis finds the range where buyers respond without giving equity away.
3: For investors
Investors need more than a fair price. They need rent levels, vacancy rates, and signs of long-term demand. A market analysis shows whether a city or district can support the returns a deal promises. It also helps compare two areas side by side.
What a real estate market analysis includes
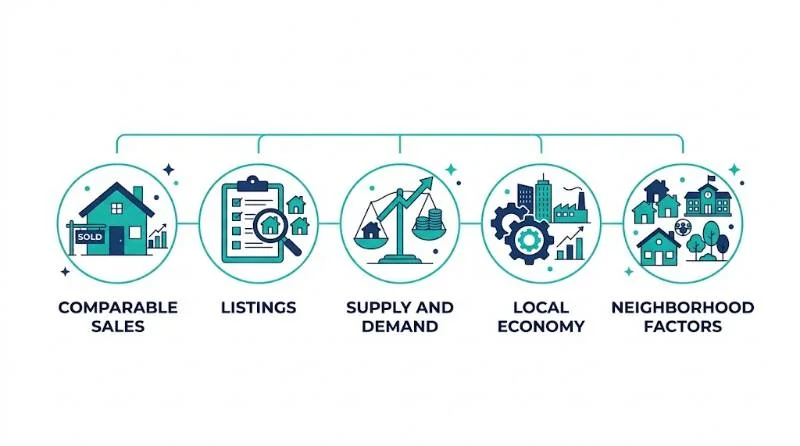
A thorough analysis pulls from five areas. You can skip some for a quick check, but each one catches a different kind of mistake.
1: Comparable sales
Comparables, or comps, are similar properties that sold recently. A common rule of thumb is sales within the last three to six months and within about a half mile. In rural areas you may need to stretch both limits.
Match bedrooms, square footage, lot size, age, and condition as closely as possible. Then adjust for differences. A finished basement or a new roof adds value that a raw comparison would miss.
2: Active, pending, and expired listings
Sold comps show the past. Listings show the present.
Active listings reveal your competition and the prices sellers hope to get. Pending listings show what buyers are accepting right now. Expired listings are homes that failed to sell, which often means the price was too high.
Ignoring expired listings is a common blind spot. They tell you where the market’s ceiling sits.
3: Supply and demand indicators
Three numbers do most of the work here. Months of supply measures how long current inventory would last at the recent sales pace. Many agents treat about six months as a balanced market. Less favors sellers and more favors buyers.
Days on market shows how fast homes move. The sale-to-list price ratio shows whether buyers pay full price, bid above it, or negotiate down.
4: Local economy and demographics
Property values follow people and jobs. Look at employment growth, major employers, population trends, income levels, and mortgage rate movement. A town that adds a hospital or factory often sees housing demand rise. A town that loses its main employer usually sees the reverse. The Census Bureau and the Bureau of Labor Statistics publish free local data.
5: Property and neighborhood factors
Finally, look at what you can see on the ground. School quality, crime levels, walkability, commute times, flood zones, property taxes, and planned construction all affect value. Two identical houses can differ widely in price because of the street they sit on.
How to do a real estate market analysis step by step
You do not need a license to run one. You need patience and clean data.
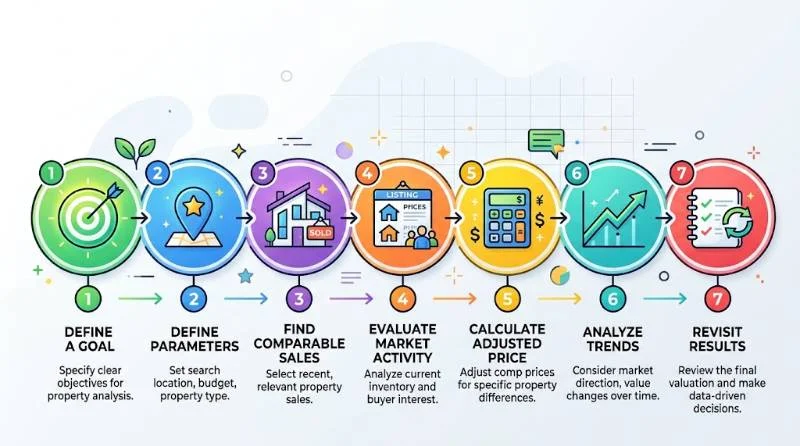
Step 1: Define your goal
Decide what you are trying to decide. Pricing a listing, judging an offer, and choosing a rental market need different data. A clear goal keeps you from collecting numbers you never use.
Step 2: Choose the area
Set a boundary around the subject property or target area. Use a neighborhood, a school zone, or a zip code. Markets change block by block, so a citywide average can mislead you.
Step 3: Gather comparable sales
Search Zillow, Redfin, or Realtor.com for sold homes that match your property. An agent can pull a more complete list from the multiple listing service, or MLS. County records confirm the final sale prices.
Step 4: Review current listings
Record active, pending, and expired listings in the same area. Note list prices, price cuts, and days on market. Repeated price cuts signal sellers who are ahead of what buyers will pay.
Step 5: Adjust and set a range
Adjust each comp for differences in size, condition, and features. Then place the results into a price range rather than a single number. Start with a ceiling based on the strongest comps. Set a floor from the weakest comps or from expired listings. The realistic value usually sits between them.
Step 6: Check the wider market
Compare your range against the trend. Prices rising for six months may justify the top of the range. Rising inventory and slower sales may argue for the bottom. Add local job and rate news to finish the picture.
Step 7: Record and revisit
Write down your sources, dates, and assumptions. Markets shift, so repeat the analysis before any major decision. In a fast market, an analysis can go stale in weeks.
A quick example of how the analysis works
Say you plan to sell a three-bedroom house. Three similar homes nearby sold in the last four months. One had a renovated kitchen and sold for the highest price. One needed work and sold for the lowest. The third matched your home closely.
You adjust the first down for its kitchen and the second up for its condition. The third needs little change. Your three adjusted values cluster into a tight range. Active listings and a falling days-on-market figure then tell you to price near the top of it.
Types of real estate market analysis
The method changes with the property type.
Residential
Residential analysis centers on single-family homes and condos. It leans on comps, listing activity, and neighborhood quality.
Rental and investment
Rental analysis adds rent comps, vacancy rates, and expense estimates. Investors often calculate cap rate and cash-on-cash return to test whether the numbers work. A house can sell well and still make a poor rental.
Commercial
Commercial analysis studies office, retail, industrial, and multifamily space. It uses lease rates, absorption, foot traffic, and zoning rules. Deals are larger, so professionals often hire specialists.
Where to find reliable data
Start with free sources. Zillow, Redfin, and Realtor.com show listings and sold prices. Your county recorder or assessor confirms deeds and taxes. The Census Bureau supplies demographics. The Bureau of Labor Statistics supplies jobs data. Federal Reserve Economic Data, known as FRED, tracks mortgage rates and housing indexes.
Paid platforms add rent estimates and forecasts. Agents also have MLS access, which is the most complete record of local sales. Be cautious with automated home value estimates. They are a starting point, not a verdict.
Common mistakes and when the analysis falls short
Even careful analyses fail for predictable reasons.
Stale comps cause the most damage. A sale from a year ago in a rising or falling market tells you little.
Mismatched comps come second. A renovated home does not compare with a dated one just because they share a street.
Thin markets are a real limit. Rural areas, luxury homes, and one-of-a-kind properties have few good comps. In these cases, widen your search and consider a professional appraisal.
Emotion also distorts results. Sellers tend to value their own renovations too highly. Buyers tend to fall for a house and stretch the range upward. Let the data set the number.
Remember the limit of the tool itself. A market analysis estimates value. It does not guarantee a sale price. Two bidders can push a price well above any range