
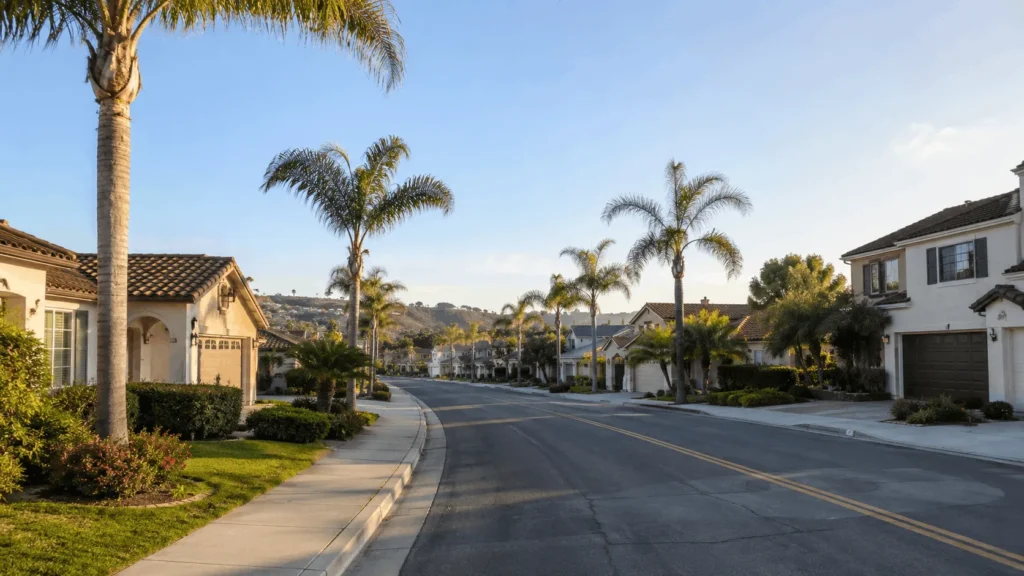

Oceanside real estate is priced in the mid $800,000s to low $900,000s as of mid 2026, with homes typically going pending inside three weeks in a market that still favors sellers despite slower buyer traffic. Homes sold for a median price of $885,000 over the last 30 days, up 8.1 percent year over year, with a median of 22 days on the market. Redfin’s most recent read puts the median sale price at $875,000, up 7.3 percent year over year, with homes receiving an average of 2 offers and selling in around 42 days. If you are trying to decide whether to buy, sell, or just watch this North County San Diego coastal city from the sidelines, here is what the numbers and the neighborhoods actually say
Current State of the Oceanside Housing Market
Median Home Prices and Recent Trends
Pricing has moved in a narrow band for the past year rather than swinging wildly. The median sales price sits at $914,490 through the first half of 2026, up 1.7 percent year over year, in a market with 3.5 months of supply that leans slightly toward sellers. Zillow’s own home value index tells a slightly different story depending on the exact boundary used, showing the typical home value closer to $816,000 and down 1.1 percent over the past year, which is a reminder that “median sale price” and “average home value” are not the same metric and can point in different directions in the same month. Price per square foot has also climbed, with the most recent 30-day figure at $553, up 2.2 percent year over year
Inventory and Days on Market
Supply is genuinely tight compared to a normal, balanced market. Most sub-markets are holding between 1.1 and 2.1 months of supply, well below what’s considered balanced, and total active listings were down 7.6 percent year over year even as new listings also declined. That combination, fewer new listings and fewer total homes for sale, is what keeps well-priced properties moving quickly even as overall buyer urgency has cooled. Days on market vary by source and by month: Movoto’s May 2026 read shows 60 days on average, up from 53 last year, while Redfin’s more recent snapshot shows homes moving in 42 days. The gap between those numbers usually comes down to timing and which home types are included, not a contradiction in the underlying marke
Popular Oceanside Neighborhoods for Buyers
West of I-5 Coastal Corridor
This strip closest to the water is its own micro-market. It ranges from $715,000 condos up to multi-million-dollar oceanfront estates, with strong demand across every price tier. Buyers here are paying for walkability to the beach and the harbor, not square footage, and detached homes in this corridor have seen sales velocity increase even when prices themselves adjust slightly.
Oceanside East, ZIP 92056
East Oceanside is where families and value-conscious buyers are landing. It offers larger tracts, newer housing, and more predictable floor plans, popular with families and military buyers seeking value, and it remains one of the better value propositions in North County Coastal for buyers priced out of Carlsbad and Encinitas. The average home value here sits around $875,349, down slightly year over year, which is drawing buyers who got outbid closer to the coast. Condos and townhomes in this ZIP code have seen some of the sharpest appreciation in the city, up as much as 30 percent in places, as buyers look for a more attainable entry point.
Downtown Oceanside and the Harbor District
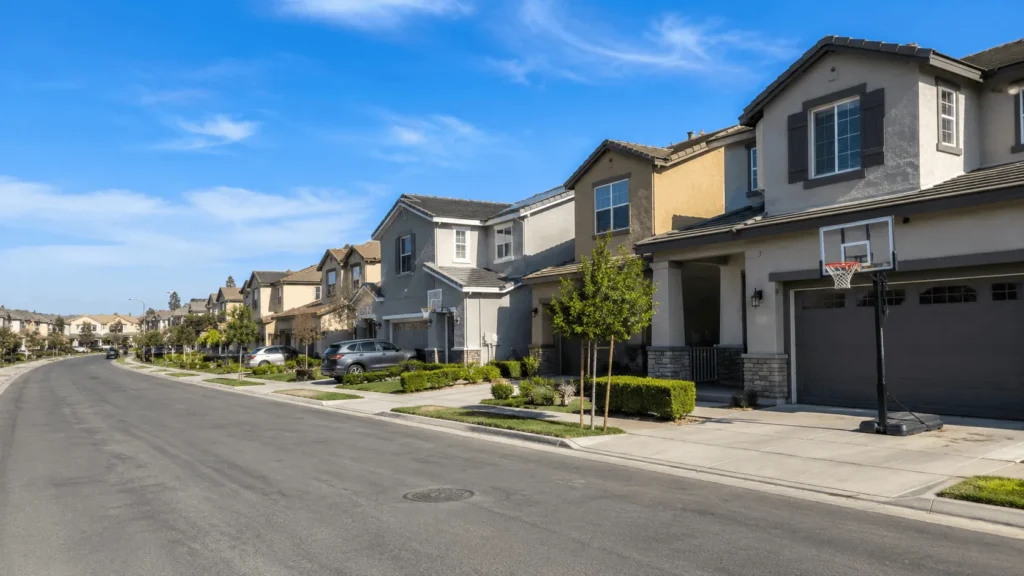
South Oceanside, including the downtown corridor and harbor area, continues to draw buyers who want walkable access to restaurants, the pier, and the beach itself, and this segment tends to hold its value even when the broader market slows because inventory here rarely sits long. Master-planned communities further inland, like Ocean Hills, see fierce competition for limited listings whenever one becomes available, since turnover in these communities is naturally slower.
Oceanside Schools and Family Considerations
Buyers relocating with kids should know Oceanside sits within the San Diego County school system, with 48 elementary schools, 27 middle schools, and 18 high schools serving the area, plus 22 private schools and 5 charter schools for families weighing alternatives. GreatSchools rates the average public school here around 5 out of 10, which means school quality varies noticeably block by block, and it’s worth checking the specific assigned school for any address before making an offer rather than assuming citywide averages apply evenly.
Should You Buy in Oceanside Right Now
Why Buyers Are Still Competing for Coastal Listings
Even with days on market stretching out citywide, buyers continue paying near list price for well-located coastal properties, especially anything within walking distance of the beach or downtown. If your target area is west of I-5, expect multiple offers on anything priced correctly, and budget time to lose a bid or two before you win one. The sale-to-list price ratio recently sat at 100 percent, with 47 percent of homes selling above list price, so buyers should assume asking price is a starting point, not a ceiling, in the most desirable pockets
Where Buyers Are Finding More Room to Negotiate
Away from the coastline, leverage shifts. In tighter inventory pockets like 92056, competition for listed homes stays fierce, but in slower-moving segments of the market, sellers are more open to concessions, rate buydowns, or repair credits than they were two years ago. Price reductions still happen, just less frequently than in a genuinely buyer-favorable market, and roughly 18 percent of listings drop in price at some point before selling.
Selling a Home in Oceanside: What’s Working
Pricing Accuracy Matters More Than Ever
The current market punishes overpricing more than it rewards it. Homes that are updated, well presented, and accurately priced from day one are still commanding strong results, while properties listed above market are sitting and eventually chasing the price down, which costs sellers more in the end than pricing correctly from the start. This is best described as a condition-driven, pricing-sensitive market rather than a distressed one.
Condition and Presentation Drive Offers
With close to half of homes selling above list price in the most recent window, presentation is doing real work. Buyers browsing Zillow, Realtor.com, and Homes.com are scrolling past dozens of similar listings in seconds, so photos, staging, and a clean first impression online determine which homes get a showing at all.

Renting and Investment Potential in Oceanside
Oceanside’s mix of year-round coastal demand, Camp Pendleton turnover, and limited new construction supports steady rental demand across price points, from beach-adjacent condos to family homes in 92056. Long-term forecasts point to continued price appreciation over the next several years rather than a sharp correction, which is part of why investors continue to treat the city as a stable, if no longer cheap, entry point into North County coastal real estate. Investors should still run the numbers on rent versus carrying costs for each specific property rather than assuming appreciation alone will make a deal work.
Working With a Local Agent vs Browsing National Listing Sites
Zillow, Realtor.com, and Homes.com are useful for a first pass at what is on the market, but none of them can tell you that a specific block in 92056 floods differently than the one two streets over, or that a particular HOA in a master-planned community has a pending special assessment. A local Oceanside agent tracks micro-market shifts by ZIP code and even by street, which is the difference between a listing price that is a rough estimate and one that reflects what buyers in that exact pocket are actually paying this month.
Financing and Military Relocation Considerations
Oceanside’s proximity to Camp Pendleton means a meaningful share of both buyers and sellers are active-duty military working on relocation timelines that don’t match a typical civilian closing schedule. VA loan buyers competing against cash or conventional offers in a low-inventory market often need an agent who can position a VA offer competitively on price and terms, not just rely on the loan program itself, since sellers weighing multiple offers still care about certainty of close as much as the number on the page.



![Laptop showing a real estate asset management software dashboard with portfolio performance charts H2: What Is Real Estate Asset Management Software Real estate asset management software is a platform built to track the financial and operational performance of properties across an entire portfolio. Instead of pulling numbers from separate rent rolls, accounting exports, and appraisal reports, the software aggregates that data into one place. From there, it generates the metrics asset managers rely on daily. That includes net operating income, occupancy, cap rate, and internal rate of return, updated automatically as new data comes in. The goal isn't just storage. A good platform turns raw property data into decisions. It flags underperforming assets and surfaces lease expirations before they become a problem. It also gives teams a consistent way to report to investors or ownership. H2: Real Estate Asset Management vs. Property Management vs. Portfolio Management Software These three terms get used interchangeably, but they solve different problems, and picking the wrong category is a common early mistake. H3: Property management software Property management software handles the day to day operations of a single building or a small set of properties. Think maintenance requests, tenant communication, and rent collection. It's built for property managers on site, not for someone evaluating a portfolio's financial performance. H3: Portfolio management software Portfolio management software sits a level higher. It looks across many properties or funds at once. The focus is allocation, diversification, and aggregate returns, rather than the operational details of any single asset. H3: Real estate asset management software Real estate asset management software sits between the two. It cares about the financial and strategic performance of individual assets, but it also rolls that data up into portfolio-level reporting. Many platforms in this category now blend elements of all three. That overlap is part of why the naming gets confusing once you start comparing vendors. H2: Who Uses Real Estate Asset Management Software Asset managers overseeing commercial, multifamily, or industrial portfolios are the core users, but the category serves several related roles. Institutional investors and pension funds use it to track performance across large, geographically spread holdings. Family offices rely on it to consolidate real estate alongside other investments without hiring a full analytics team. Private equity real estate firms use it to monitor fund performance and prepare investor reporting on a predictable schedule. Publicly traded REITs use similar tools to standardize disclosures across regulatory filings and quarterly investor updates. Corporate real estate teams use a related toolset to manage owned and leased facilities as operating costs rather than investments. The common thread across all of these users is the same problem. Property data lives in too many disconnected systems to make fast, confident decisions. H2: Core Features to Look For Most platforms in this category share a similar feature set, though the depth varies quite a bit between vendors. Portfolio and asset tracking that consolidates property details, ownership structure, and unit-level data in one place. Automated financial reporting that pulls net operating income, cash flow, and variance reports without manual spreadsheet work. Lease and rent roll management that tracks lease terms, escalations, and renewal dates across every property. Budgeting and forecasting tools that let teams model different scenarios before committing capital. Customizable dashboards that surface the key performance indicators each stakeholder actually cares about. Document management for leases, appraisals, and inspection reports tied directly to the relevant property. Integration or API access that connects the platform to existing accounting systems, such as Yardi or MRI. This keeps data from being entered twice. Not every portfolio needs every feature on this list. A smaller investor managing a handful of properties may only need solid reporting and rent roll tracking. An institutional fund, by contrast, will lean heavily on integrations and forecasting. Image needed, prompt is here: [A photo-realistic close-up of a computer monitor displaying a real estate asset management software interface with KPI cards for net operating income, occupancy rate, and cap rate, alongside a portfolio map view, clean modern office setting, 16:9 aspect ratio] Image Title: Real Estate Asset Management Software KPI Dashboard Alt Text: Real estate asset management software dashboard showing NOI, occupancy, and cap rate metrics H2: Key Benefits of Using Real Estate Asset Management Software The most immediate benefit is time. Teams that used to spend days each month compiling reports from scattered spreadsheets can generate the same reports in minutes. That happens once the underlying data is centralized in one platform. Beyond speed, the software improves the quality of decisions. When NOI, occupancy, and lease data sit in one dashboard instead of five separate files, patterns emerge fast. Trends that used to go unnoticed become obvious within minutes. A portfolio manager can spot an underperforming property or an upcoming lease cliff weeks earlier than a manual review would catch it. It also standardizes reporting across a portfolio. This matters most when properties were acquired at different times, from different sellers, each with their own record-keeping habits. Consistent reporting makes it far easier to compare assets against each other and against the broader portfolio. Finally, it strengthens communication with investors and ownership. Automated, consistent reports build trust in a way that ad hoc spreadsheets never quite manage. H2: How to Choose the Right Real Estate Asset Management Software Start with scalability. A platform that works fine for ten properties can struggle once a portfolio grows past a hundred. Ask vendors directly how their system performs at your target size, not just your current one. Check integrations next. If your accounting, leasing, or CRM systems can't connect to the new platform, someone ends up re-entering data by hand. That defeats the purpose of adopting the software in the first place. Look closely at reporting flexibility. Every portfolio tracks slightly different metrics. A platform with only rigid, pre-built reports will eventually force your team to work around the tool instead of with it. Security and compliance matter more than most buyers expect going in. Ask about data encryption and access controls. Also ask whether the vendor holds a SOC 2 report, especially if you manage capital on behalf of institutional investors. Finally, weigh ease of use and onboarding support. A powerful platform that your team avoids because it's hard to use delivers less value than a simpler one people actually adopt. Image needed, prompt is here: [A photo-realistic image of a small team of professionals in business casual attire gathered around a conference table reviewing a printed checklist and a laptop showing software comparison charts, bright modern office, 16:9 aspect ratio] Image Title: Choosing Real Estate Asset Management Software as a Team Alt Text: Team evaluating real estate asset management software options around a conference table H2: Common Implementation Challenges Migrating historical data from spreadsheets is usually the biggest early hurdle. Years of inconsistent formatting rarely map cleanly into a new system. Budget real time for cleanup rather than assuming a quick import will handle it. Adoption is the second challenge, and it's often underestimated. A platform only pays off once the whole team uses it consistently instead of falling back on the spreadsheets they're used to. Naming an internal champion who can answer questions and enforce consistent data entry makes a measurable difference here. Integration friction shows up when accounting or leasing systems weren't part of the original evaluation. Confirm compatibility before signing a contract, not after, since retrofitting integrations later is far more expensive than checking upfront. H2: How Long Does Implementation Typically Take Implementation timelines vary by portfolio size and how much historical data needs to move into the new system. A small portfolio with clean records might get a platform mostly operational within a few weeks. A large institutional portfolio with fragmented, decades-old records takes longer. Realistically, expect two to four months to fully migrate, configure, and validate the system before the team relies on it for reporting. Vendors sometimes quote faster timelines than what actually plays out once data cleanup and integration testing get factored in. Ask for a realistic timeline based on portfolios similar in size to yours, not the best-case scenario used in a sales pitch. H2: How AI Is Changing Real Estate Asset Management Software The biggest shift in this category over the past few years has been automation around unstructured data. Lease abstraction tools can now pull key terms directly from PDF leases instead of a person reading and entering them by hand. That includes start dates, escalations, and renewal options. Forecasting has also improved. Instead of static spreadsheet models, some platforms now run scenario analysis using live portfolio data. Projections update automatically as new information comes in. This doesn't replace the judgment of an experienced asset manager. It does remove a lot of the manual work that used to eat up their week. Image needed, prompt is here: [A photo-realistic illustration of a document being scanned and converted into structured data on a screen, showing lease clauses transforming into organized table rows with icons representing dates and dollar amounts, cool blue tech-forward lighting, 16:9 aspect ratio] Image Title: AI Lease Abstraction in Real Estate Asset Management Software Alt Text: AI-powered lease abstraction feature inside real estate asset management software H2: Typical Pricing Models Pricing in this category varies more than most software niches. Portfolio size affects both the value delivered and the underlying data volume a platform has to handle. Smaller platforms often charge a flat monthly fee per user, which works well for individual investors or small teams. Mid-sized platforms frequently price per property or per unit, scaling naturally as a portfolio grows. Larger institutional platforms tend to move to custom, quote-based pricing tied to assets under management. Implementation and support fees often aren't visible in a public price list. Whatever the model, ask for a breakdown that separates the base subscription from implementation and integrations. Per-report or per-user add-ons can shift the real cost significantly once a contract is signed. Choosing a platform ultimately comes down to matching the software's depth to how your portfolio operates today. Build around the portfolio you have now, not the one you might have in five years. Start with the features your team uses weekly and confirm the integrations that matter most. Treat everything else as a bonus rather than a requirement.](https://estatewiser.net/wp-content/uploads/2026/08/Real-Estate-Asset-Management-Software-Portfolio-Dashboard.webp)